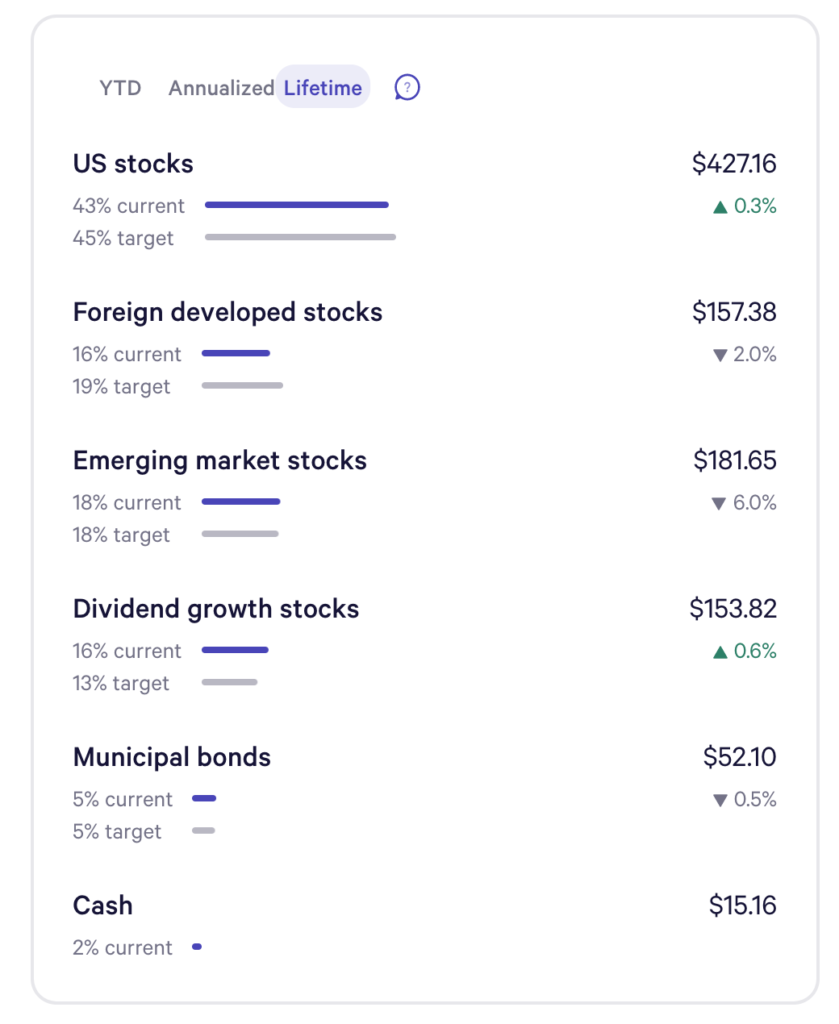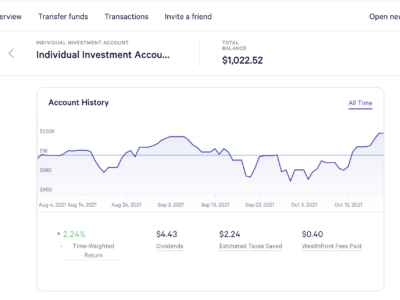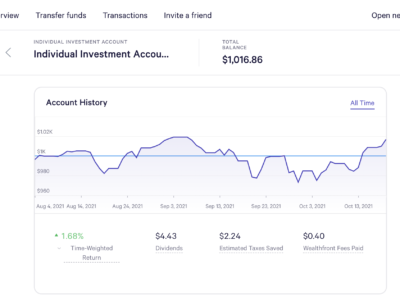
Early August of this year, I invested $1000 to Wealthfront as an experiment to compare against REITs, they distributed into several ETF funds based on the risk level I chose. I answered a few questions and it chose a 9.5 of 10 risk portfolio, that’s designed to maximize my returns while keeping it diversified. This risk portfolio was spread across 5 funds and some cash: US Stocks , Foreign developed stocks, Emerging market stocks, Dividend growth stocks, Municipal bonds, Cash
Now that we’re almost several weeks in, we’re getting some interesting comparisons between the 5 funds. I’m actually going to focus on the first 3 more in detail, but will still give a few thoughts on the dividend growth stocks and municipal bonds. It’s really interesting because now we can start to see how each fund is performing. What’s I’ve also done is take graphs of the month performance and the lifetime performance of each fund as I think it’s extra information that will allow us to learn more.
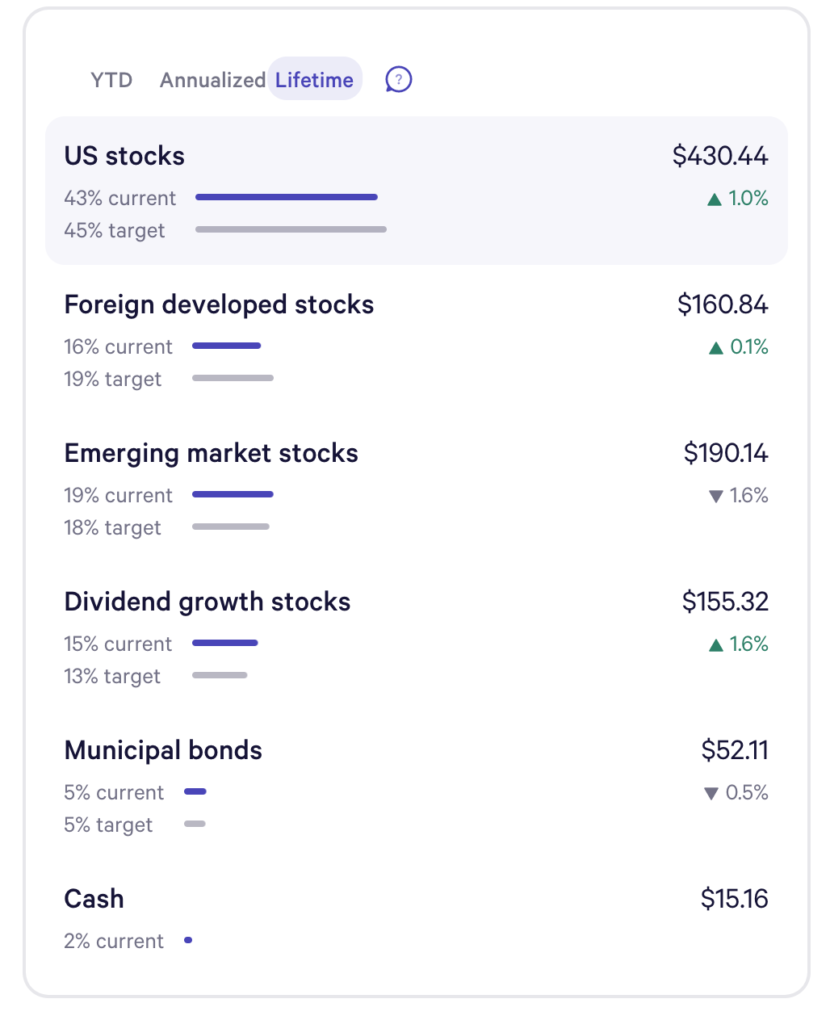
VTI – Vanguard Total Stock Market ETF (US Stocks) – 45% allocation
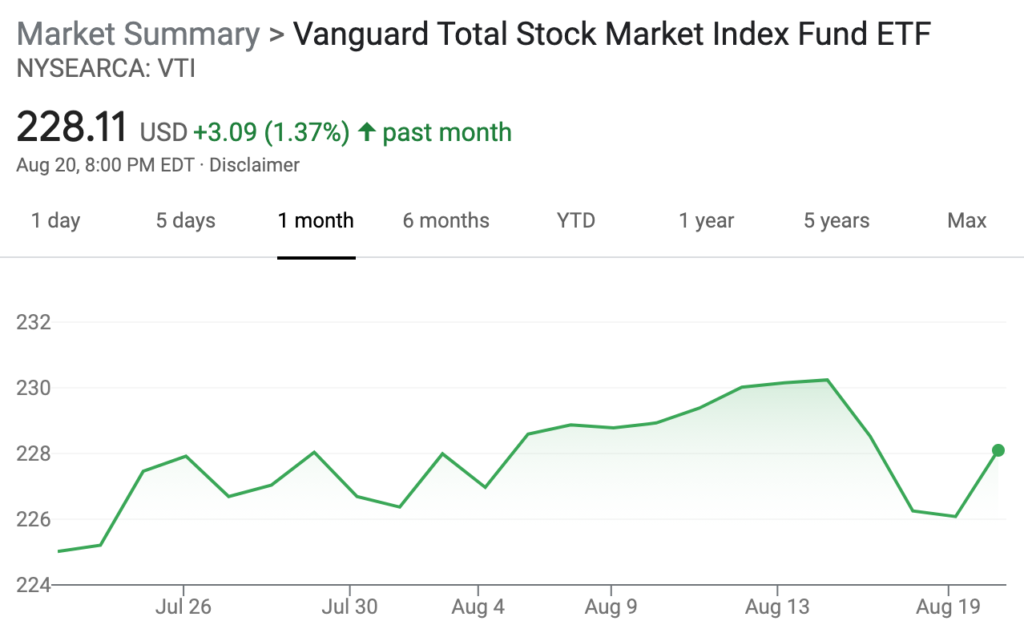
You can see with VTI – a fund I’m familiar with, it’s has general increases besides the recent week of stock declines which has been documented in my other articles due to the effects of external news, Fed buybacks scaling back, Delta variant, etc. As we compare this fund to the rest, it’s actually the one that has out performed the other 5 funds as you’ll see as you look at the rest.
- August 12 – $430.44 (1.0% increase)
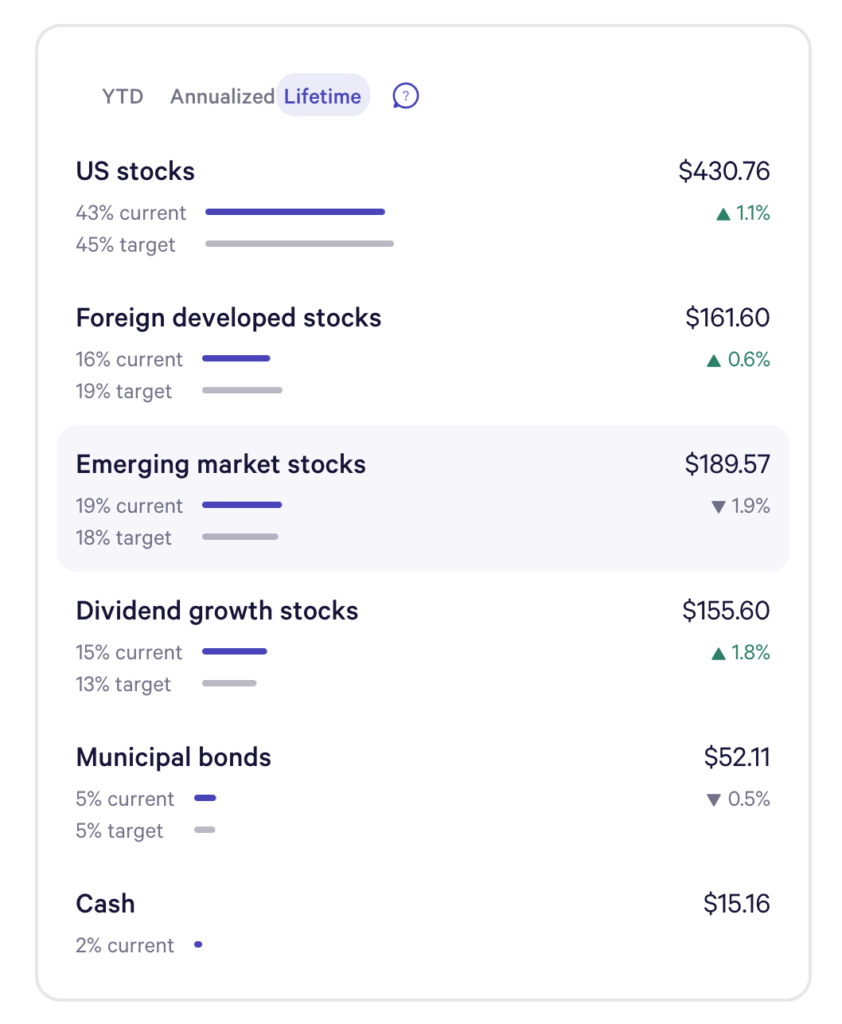
- August 14 – $ 430.76 (1.1% increase)
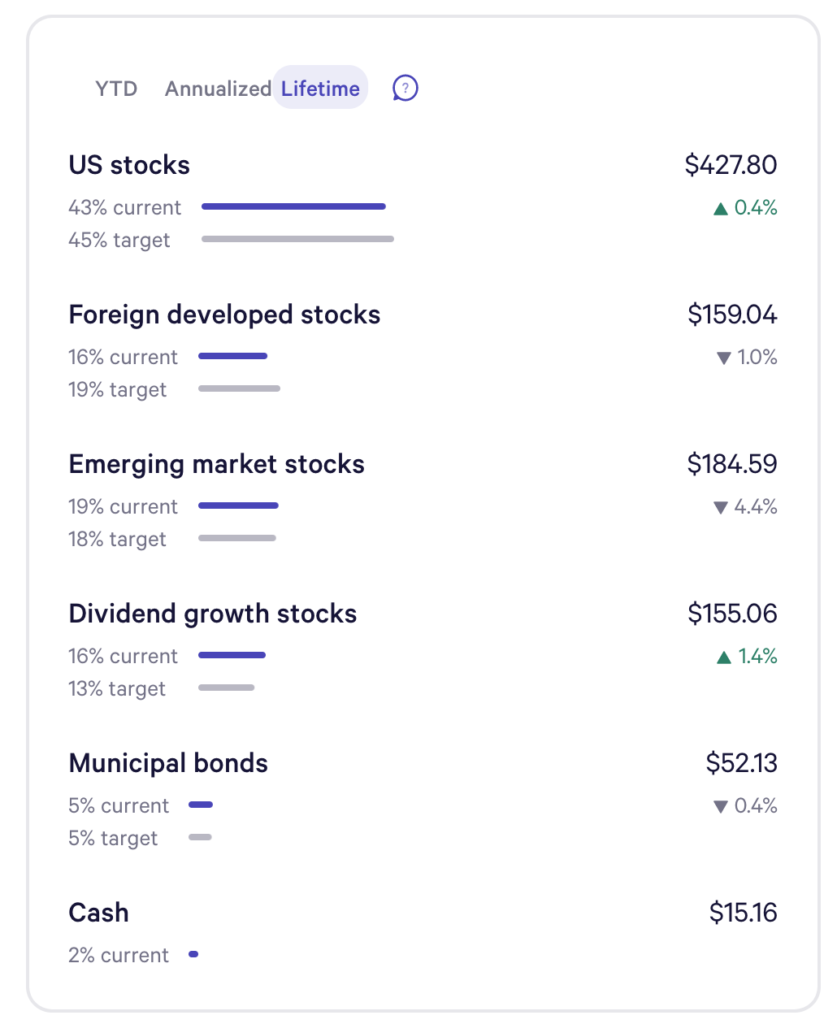
- August 16 – $427.80 (0.4% increase)
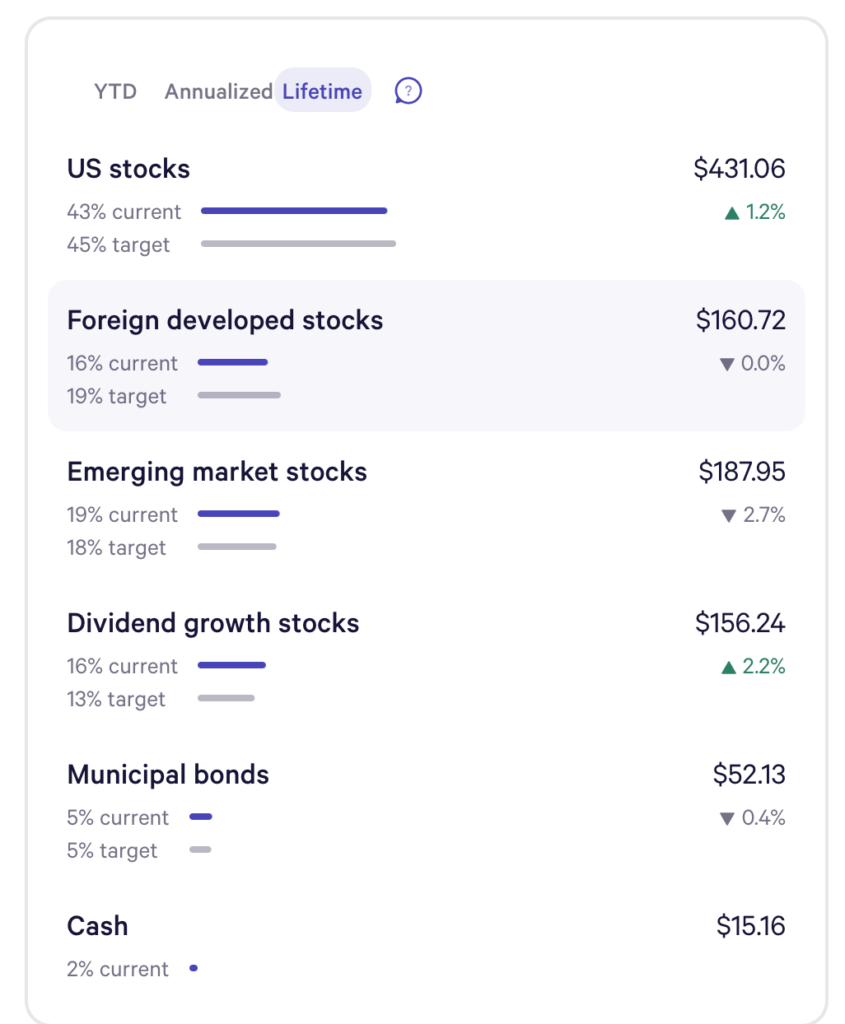
- August 17 – $431.06 (1.2% increase)
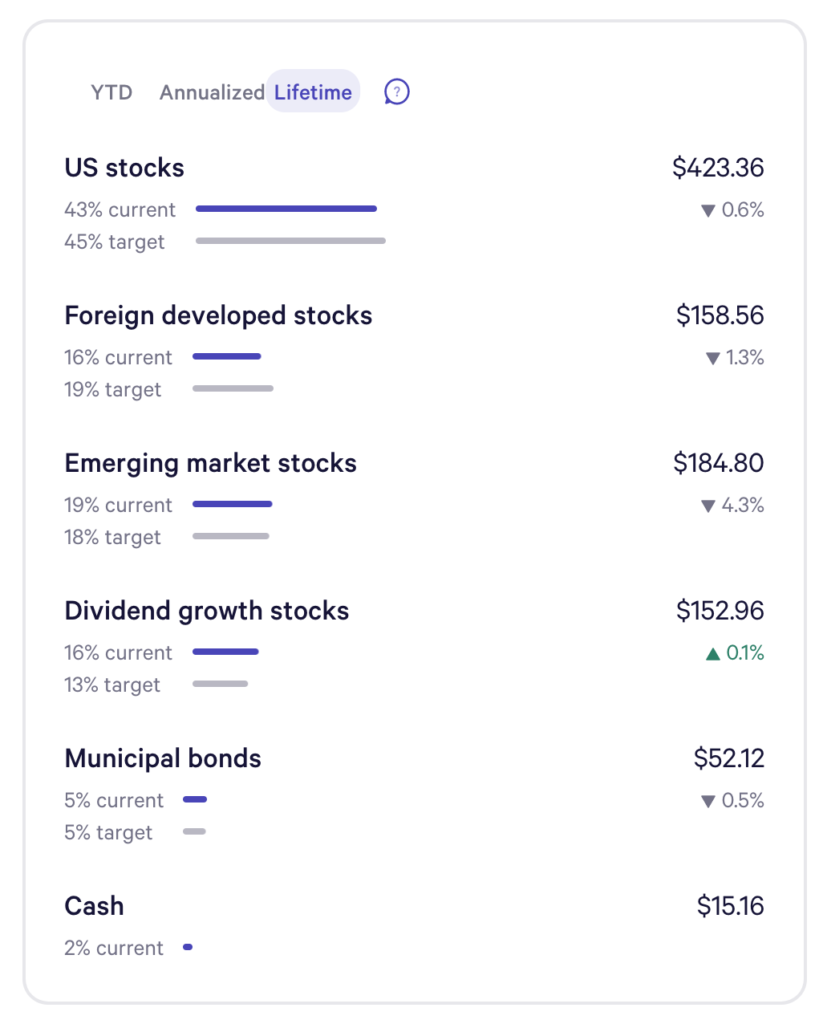
- August 18 – $423.36 (0.6% decrease)
- August 19 – $426.16 (0.6% decrease)
- August 20 – $427.16 (0.7% increase)
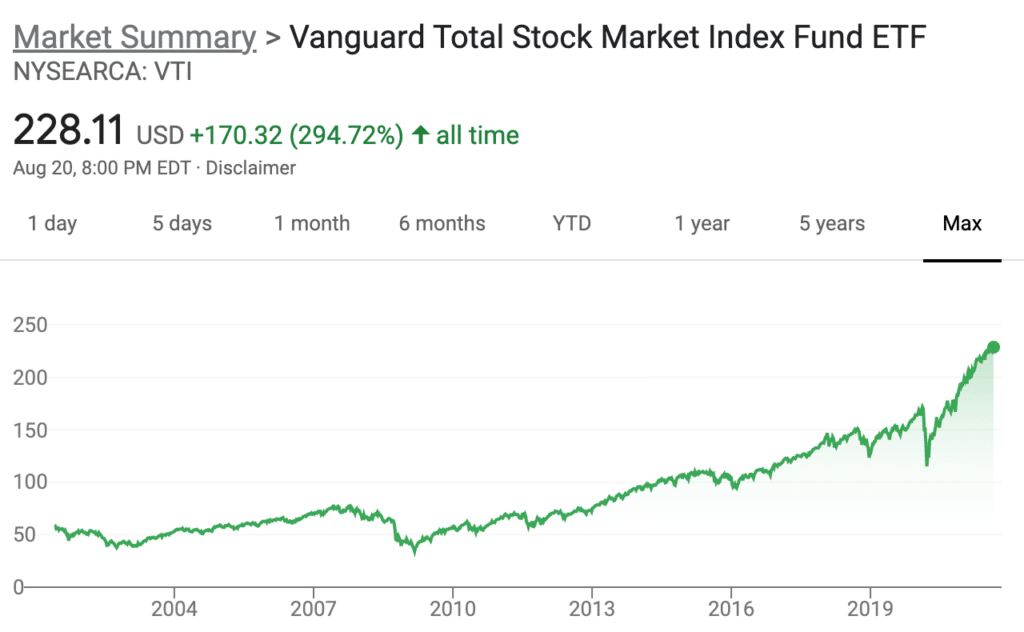
What’s a bit more interesting is although we see those increases and decrease through out the month, with some nice gains early August and the losses in the last week, the overall growth since early 2000 til now has been phenomenal.
Below, you can see it’s actually growing in par with the S&P500 which represents the US stock market growth of the 500 largest companies. We can also see two major dips which we’re familiar with. The 2008 recession of sub-prime mortgages that left us with challenges with unemployment rates and a slow recovery. Also paved the wave for the great 10% gains the last decade as well as cheap real estate from 2012 – 2015. The second dip we see is reflective of March 2020 and the start of the pandemic where the economy reacted to the crisis and the closures of most brick-and-mortar stores, as well as the quick recovery and boom that we’re seeing now.
VEA – Vanguard FTSE Developed Markets ETF (Foreign developed stocks) – 19% allocation
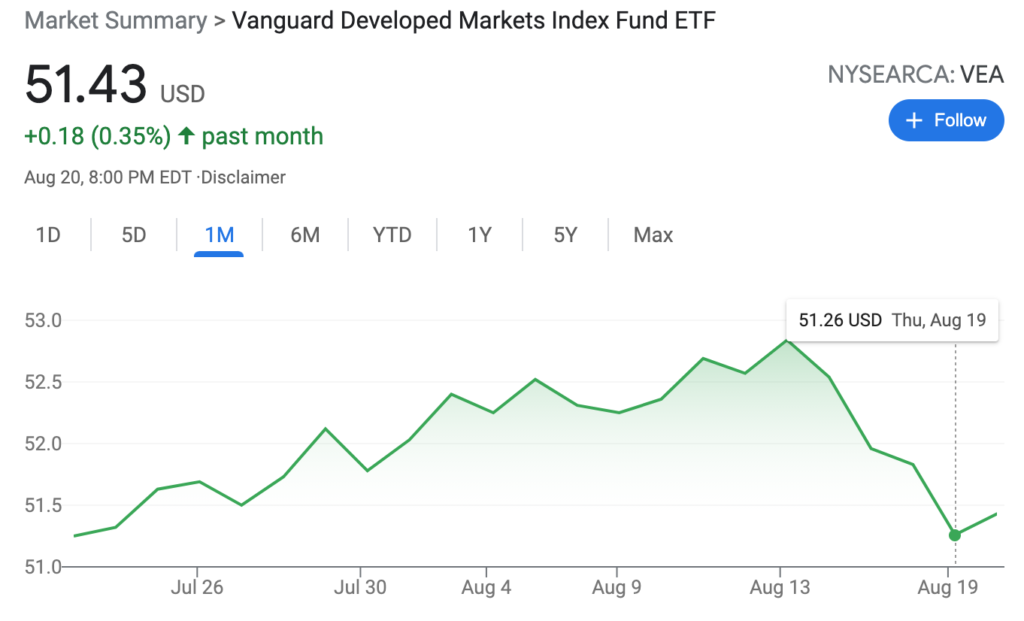
This one is interesting as VEA focuses on developed markets. This fund match the performance of a diversified group of stocks of large-, mid-, and small-cap companies located in Canada and the major markets of Europe and the Pacific region. As we compared those days, we saw a first day of increases, then began to see substantial decreases, besides today’s increase. The month graph shows a nice climb followed by the bumpy week we’ve seen.
- August 12 – $160.84 (0.1% increase)
- August 14 – $ 161.60 (0.6% increase)
- August 16 – $159.04 (1.0% decrease)
- August 17 – $160.72
- August 18 – $158.56 (1.3% decrease)
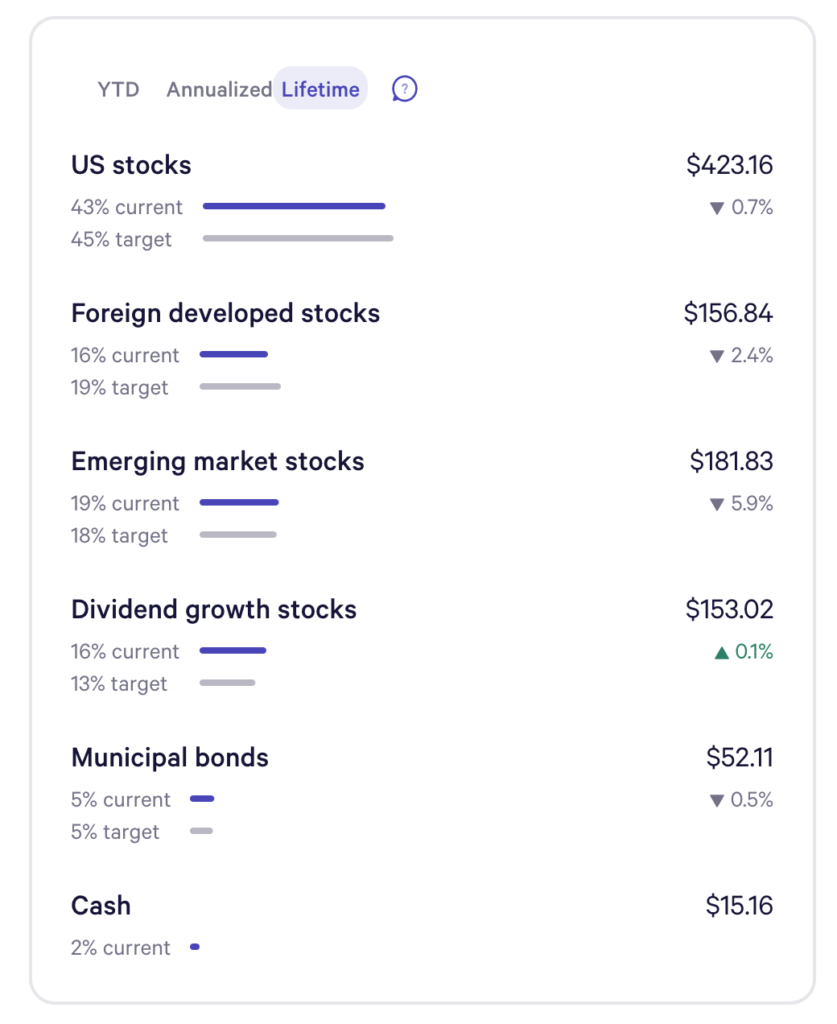
- August 19 – $156.84 (2.4% decrease)
- August 20 – $157.38 (2.0% decrease)
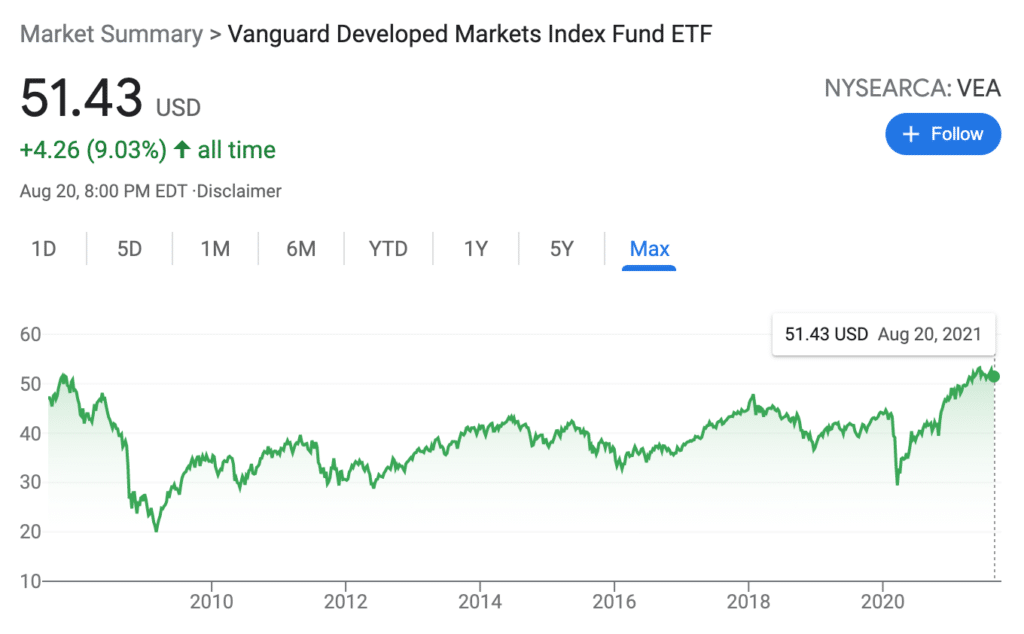
This fund has also been around for sometime, early 2000s, but what I find interesting is it doesn’t compare to VTI – where this fund, VEA is almost a tiny bit higher than the 2008 recession, but has not double in growth like S&P 500 or VTI. It’s an important comparison to look at this and the macro as we’re really targeting long term gains with Wealthfront investments.
In my opinion, I would not have put 19% in this fund and would consider shifting some assets back to VTI which currently accounts for 45% of my $1000 allocation.
VWO – Vanguard FTSE Emerging Markets ETF (Emerging market stocks) – 18% allocation
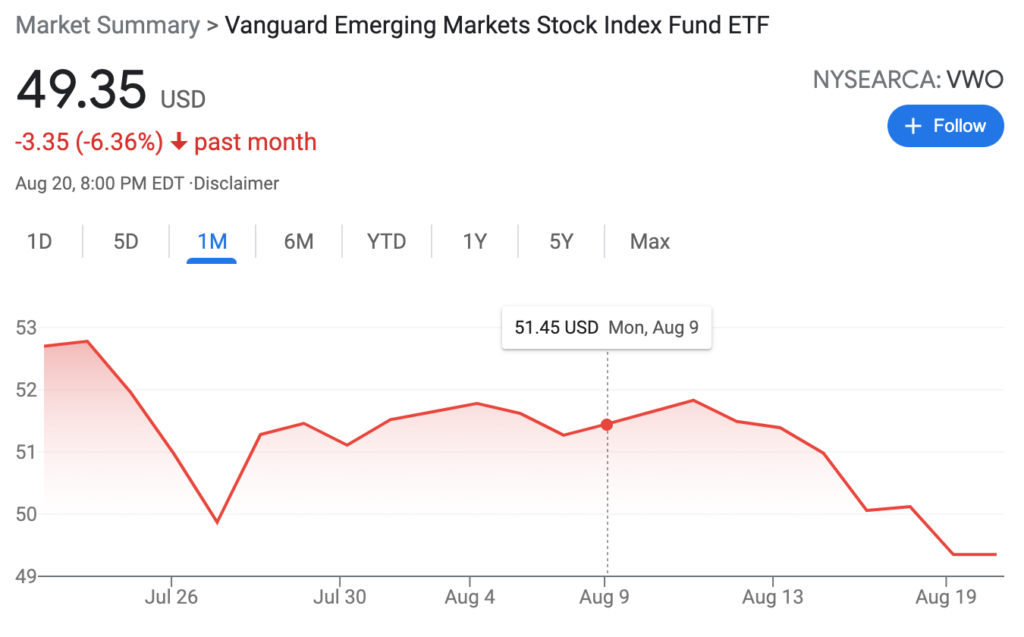
The VWO, or Emerging Market ETF has been the bottle neck of my stock growth. It’s actually the one that’s brought me the greatest amount of losses. Not just this week where all stocks have felt, but in generally all the snapshots I took during the REIT vs Stock comparison, besides August 17, where we had a tiny increase.
This stock invests in stocks of companies located in emerging markets around the world, such as China, Brazil, Taiwan, and South Africa. It’s described as a “high potential for growth, but also high risk; share value may swing up and down more than that of stock funds that invest in developed countries, including the United States.”
- August 12 – $190.14 (1.6% decrease)
- August 14 – $ 189.57 (1.9% decrease)
- August 16 – $184.59 (4.4% decrease)
- August 17 – $187.95 (2.7% increase)
- August 18 – $184.80 (4.3% decrease)
- August 19 – $181.83 (5.9% decrease)
- August 20 – $181.65 (6.0% decrease)
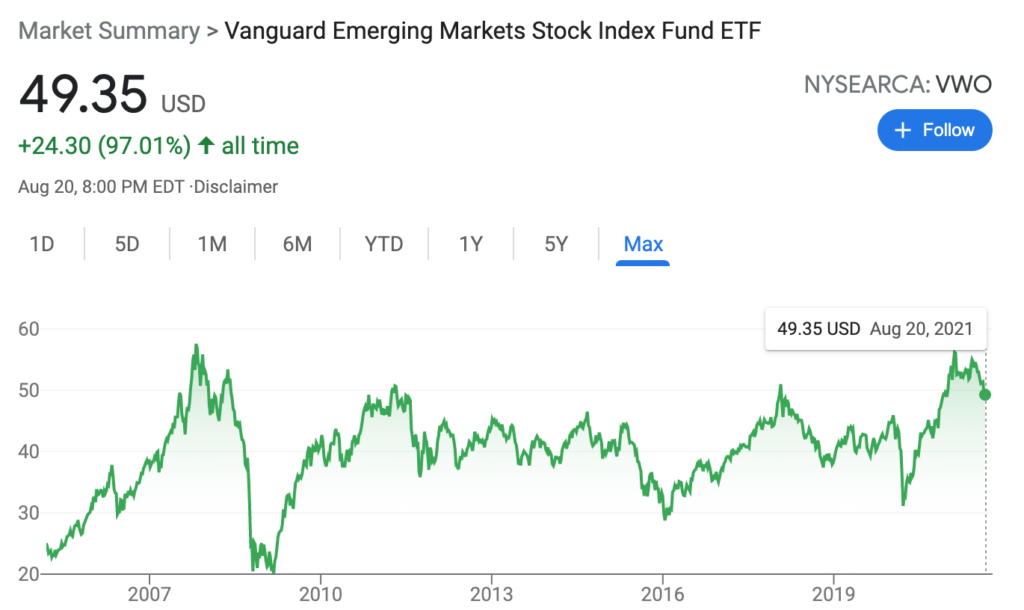
Looking at the month view above, it’s definitely not performing well, the graph mark’s this past month as a loss of 6.36% and has colored it red, a visual indicator of something that’s not so great. Looking at the overall growth (max view in the graph), it’s also been around since early 2000s, but suffered greatly during the 2008 recession, almost dropping down to it’s initital or near $1-10 USD dollars per share. It’s growth is comparable to the highs right before the 2008 recession. It suffered some loss during the pandemic, but not as substantial as the great recession. It’s debatable on this, it could be due to parts of asian not as bad as the US, or it just didn’t affect these emerging companies that are allocated in this fund. Something to read up on for next time.
VIG – Vanguard Dividend Appreciation ETF (Dividend growth stocks) – 13% allocation
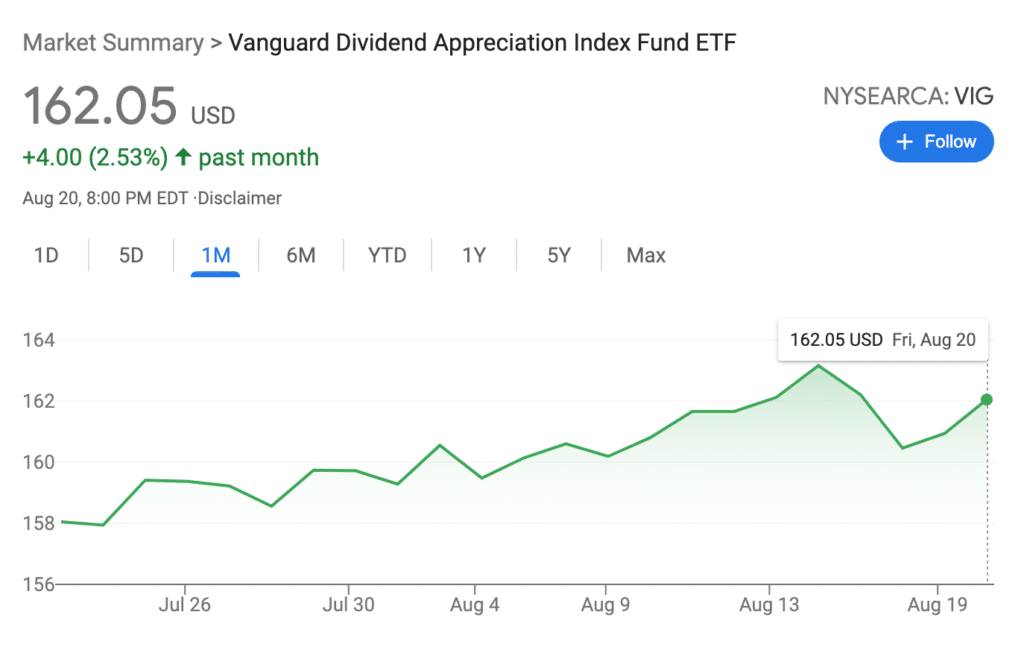
I didn’t break down the days as I did the 3 funds above, but Vanguard Dividend has has some nice gains despite the losses in the stock market.
What is this fund? Well, it tracks the performance of the NASDAQ US Dividend Achievers Select Index. And that means its chosen companies or a select group of securities with at least ten consecutive years of increasing annual regular dividend payments. It pretty much means strong companies that have regularly paid their shareholders dividends.
Compared to VTI which is more of a growth stock vs dividend stock fund, VIG has grown at 2.53% increase this past month, compared to 1.37% increase from VTI. It’s definitely the strongest fund we’ve had since we opened this Wealthfront account.
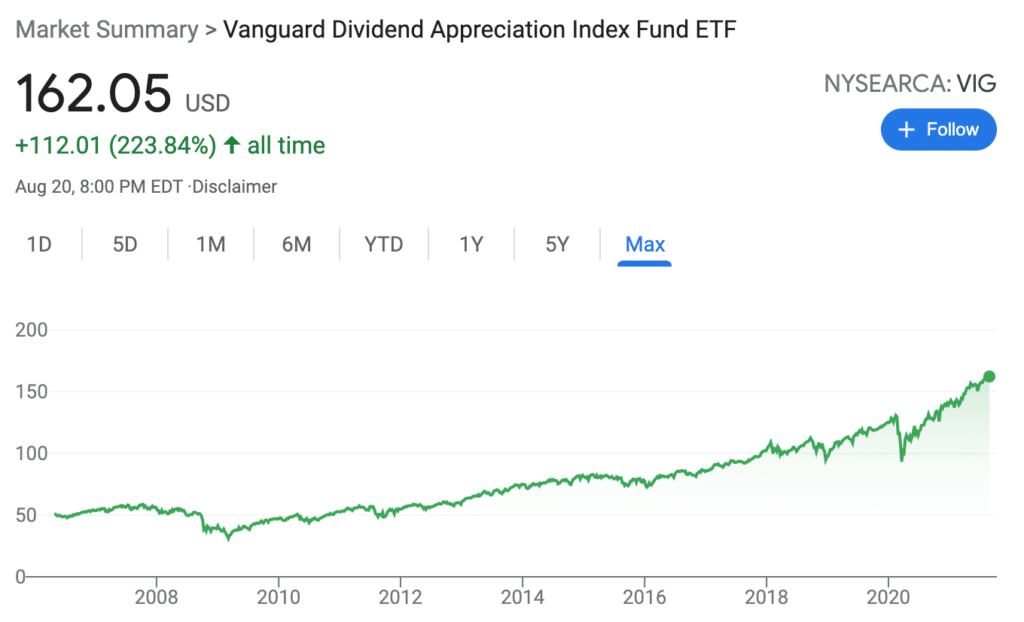
Looking at the overall performance, VIG hasn’t been around as long as VTI, but it’s been pretty solid. Less affects by the great recession (2008), has had great increases, and continues to perform. Obviously this one was hit by the pandemic like all companies, funds, and economics around the world. From these data points though, it’s the most stable of all the funds. Obviously, it’s still too early to tell without doing more research or waiting to see how it performs with out investment.
I’m surprised it’s only 13% allocation of my $1000, but I’m sure Wealthfront has a reason for this – hopefully.
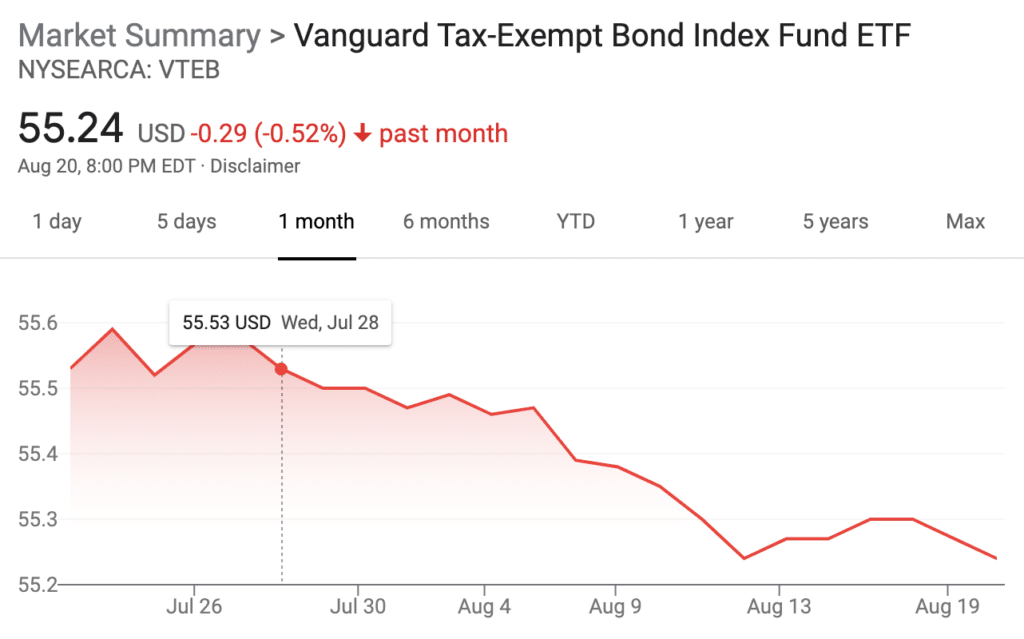
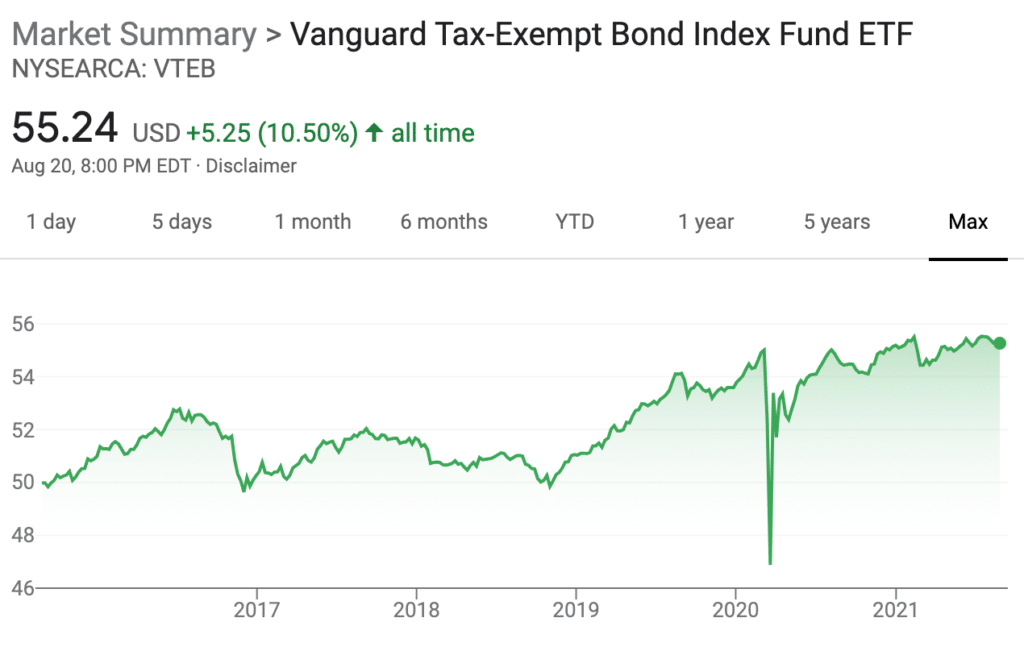
VTEB – Vanguard Tax-Exempt Bond Index ETC (Municipal bonds) – 5% allocation
The bond market isn’t looking too well. It’s only 5% of my $1000 allocation so I didn’t spend as much time looking at the daily changes that I recorded in the first 3 funds, but looking at this months performance from the chart, it’s certainly underperforming and has mostly losses.
VTEB seek to track the performance of a benchmark index that measures the investment-grade segment of the U.S. municipal bond market. The fund employs an indexing investment approach designed to track the Standard & Poor’s National AMT-Free Municipal Bond Index. Generally speaking, I always through the bond market was much lower risk than stock market in general, but this may not be the case anymore or this fund doesn’t track exactly that. Looking at the max view of the chart – although we see gains besides the huge spike during the march 2020 pandemic, it’s honestly not enough years to compare how it will help us from a long-term perspective as it’s only been around since 2015+.
In summary – there are two funds that stand out which are VTI (US Stocks) and VIG (Dividend growth stocks) while the other 3 funds are trailing. I’m more tempted to shift and reallocate my funds away from Foreign developed stocks (VEA) and Emerging market stocks (VWO). This is something I might try next week – but it’s really a personal preference of mine.
It’s really a game in what you believe in, but I’ve invested in VTI and other US funds before and they haven’t steered me wrong.
As Warren Buffet says:
Our unwavering conclusion: Never bet against America,” Warren Buffett said in his annual letter. Buffett said the conglomerate owns the biggest amount of U.S. assets (property, plant and equipment) by value than any other company in the country. (Reference)
REITS vs Stocks challenge:
Is it bad that I’m calling an audible, the great football quarterbacks do it. But as assets shift from Fundrise Real Estate, I think adjustments need to be made in these default Wealthfront stocks.
Wealthfront Daily Records:
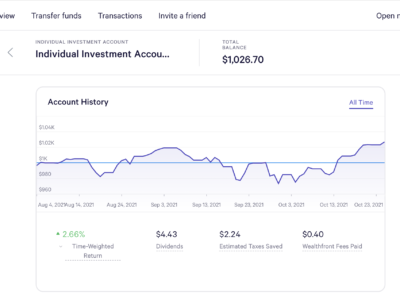
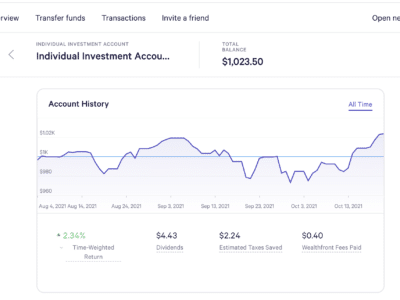
I took a number of screenshots of the fund distributions and daily changes in Wealthfront while I monitored the aggregate increases or decreases in my $1000 investment. It’s interesting to look back and compare. Obviously it’s hard to project where these stocks will go, but it’s good to begin to see the nuances of the different funds and how they perform over a short time period. This was something that was hard to know or see when my account was first opened.
August 12 – REIT vs Stocks article:
August 14 – REIT vs Stocks article:
August 16 – REIT vs Stocks article:
August 17 – REIT vs Stocks article:
August 18 – REIT vs Stocks article:
August 19 – REIT vs Stocks article:
August 20 – REIT vs Stocks article:

